
monday.com + BI: Connecting Data with Power BI, Tableau & Looker (Practical Guide)

TL;DR: „monday.com shows you WHAT is happening. BI tools show you WHY – and what should happen next."
— Till FreitagWhy monday.com alone isn't enough
monday.com is brilliant for operational work: managing tasks, steering projects, coordinating teams. The built-in dashboards deliver solid real-time overviews.
But when your CEO asks: "How has our project profitability trended compared to last year – broken down by client industry?" – native dashboards hit their limits.
This is where BI tools come in. They connect data from monday.com with CRM, ERP, finance tools and more – delivering the strategic insights that operational dashboards can't.
The 3 integration architectures
1. Direct API connection
monday.com API (GraphQL) → ETL script → BI tool- How it works: A script or connector reads data via the monday.com GraphQL API and writes it to a data warehouse or directly to the BI tool
- Advantage: Full control over data structure and refresh intervals
- Disadvantage: Development effort, API rate limits (5,000–10,000 requests/minute)
- Ideal for: Teams with dev resources and complex data requirements
2. Middleware-based (ETL/iPaaS)
monday.com → Make / n8n / Fivetran → Data Warehouse → BI tool- How it works: A middleware tool automatically extracts data, transforms it, and loads it into the warehouse
- Advantage: No code required, visual configuration, reliable scheduling
- Disadvantage: Ongoing costs, limited transformation capabilities
- Ideal for: SMBs without a dedicated data team
3. Native connectors
monday.com → Native BI connector → Dashboard- How it works: Power BI, Tableau, or Looker offer (sometimes via third-party) direct monday.com connectors
- Advantage: Fastest setup, often plug-and-play
- Disadvantage: Limited data modeling, dependency on connector vendor
- Ideal for: Quick proof-of-concepts and simple reporting requirements
Power BI, Tableau & Looker compared
| Criterion | Power BI | Tableau | Looker (Google) |
|---|---|---|---|
| monday.com connector | Yes (community + third-party) | Via Web Data Connector | Via BigQuery + ETL |
| Strength | Microsoft ecosystem, DAX modeling | Visual analysis, ad-hoc exploration | Semantic layer (LookML), governance |
| Target audience | SMB to Enterprise (Microsoft stack) | Data analysts, visual storytelling | Data teams, enterprise governance |
| Cost (starting) | ~$10/user/month (Pro) | ~$70/user/month (Creator) | Custom (Google Cloud) |
| Real-time capability | DirectQuery available | Live connection | Yes (with BigQuery) |
| Learning curve | Medium (Excel-like) | Medium-High | High (LookML) |
| EU hosting / GDPR | Yes (Azure EU) | Yes (Tableau Cloud EU) | Yes (Google Cloud EU) |
When to choose which tool?
- Power BI: You use Microsoft 365, need fast dashboards, and are budget-conscious
- Tableau: Your analysts want maximum visual flexibility and interactive exploration
- Looker: You need a single source of truth with centralized data modeling
Practical example: Project profitability dashboard
Situation: An agency with 40 employees uses monday.com for project management and time tracking. Leadership needs a dashboard showing project margins across all clients – linked with invoice data from Billomat.
Architecture:
monday.com (Projects + Time tracking)
        ↓
    Make.com (ETL)  ←  Billomat (Invoices)
        ↓
  PostgreSQL (Warehouse)
        ↓
Power BI (Dashboard)Result:
- Real-time project margins per client and team
- Trend analysis over 12 months with seasonality patterns
- Early warning for projects below 30% margin
- Automated report every Monday morning to leadership
Typical data sources alongside monday.com
| Data source | Typical data | Connection |
|---|---|---|
| CRM (monday CRM / HubSpot) | Pipeline, deals, revenue | Native / API |
| Accounting (Billomat, Bexio) | Invoices, payments | Make / n8n |
| Time tracking (monday, Clockify) | Hours per project | API / Webhook |
| Google Analytics / Plausible | Traffic, conversions | Native connector |
| HR (Personio, BambooHR) | Capacity, utilization | API / Middleware |
Best practices for stable BI pipelines
- Data model first – Define your KPIs before you start building
- Incremental refresh – Load only changed data, not everything
- Plan for historization – monday.com overwrites values; your warehouse should store versions
- Respect API limits – Batch requests, use webhooks for real-time data
- Set up monitoring – Alerting when pipelines break or data is missing
- Separate access rights – Not everyone needs all data in the BI tool
Common mistakes
- ❌ "We'll just export CSV" – Doesn't scale, error-prone, no automation
- ❌ Wanting everything real-time – Most strategic dashboards don't need real-time updates
- ❌ No data warehouse – Going directly from source to BI only works for simple setups
- ❌ Too many KPIs – A dashboard with 40 metrics helps nobody
Next steps
The right BI architecture depends on your team size, tech stack, and the questions you need answered. We can help:
- Data inventory – What sources do you have, what's missing?
- KPI workshop – What questions should the dashboard answer?
- Architecture decision – Direct, middleware, or native?
- Pilot project – One dashboard in 2 weeks, not 2 months
Related Articles

Collaboration in monday.com: How Teams Actually Work Together
Updates, WorkDocs, guest access, dashboards, and AI – how monday.com turns asynchronous teamwork into real collaboration…
Read moreDeep Divemonday Work Management: The Complete Guide 2026
monday Work Management is more than a PM tool – it's a Work OS with 8+ views, AI agents, 200+ automations, and dashboard…
Read more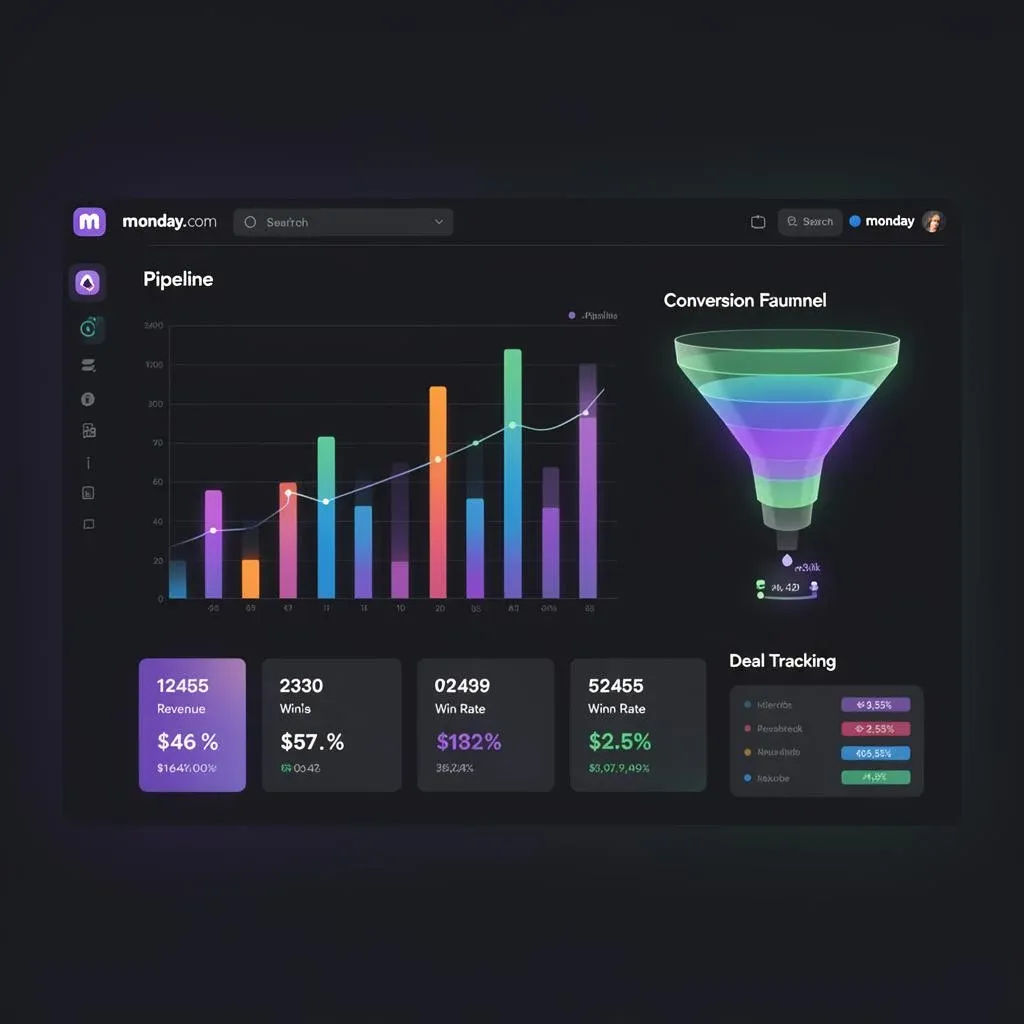
Sales Dashboards in monday CRM: The Complete Guide to Data-Driven Sales
Stop Friday reporting in spreadsheets. How to build sales dashboards in monday CRM that your team actually uses – with t…
Read more
Importing Data into monday.com – 4 Ways to Get Your Data In Cleanly
Excel upload, API, middleware, or automated scripts – we compare 4 ways to import data into monday.com, with practical e…
Read more
The Best monday.com Integrations for Design & Documentation
Connect Figma, Canva, or DocuSign with monday.com – here's how to optimize design workflows and document processes.…
Read more
The Best monday.com Integrations for HR & People Operations
Connect Personio, BambooHR, or HiBob with monday.com – here's how to digitize onboarding, time off, and recruiting.…
Read more
The Best monday.com Integrations for Finance & Accounting (2026)
Connect Billomat, sevdesk, Xero, or Stripe with monday.com – automate invoicing, payments, and financial reporting.…
Read more
The Best monday.com Integrations for Marketing & Email (2026)
Mailchimp, Brevo, Klaviyo, or monday Campaigns – how to run marketing campaigns, newsletters, and leads directly from mo…
Read more
The Best monday.com Integrations for DevOps & Development (2026)
Connect GitHub, GitLab, or Jira with monday.com – bridging development and project management seamlessly.…
Read more