Sales Dashboards in monday CRM: Der komplette Guide für datengetriebenen Vertrieb

TL;DR: „Das beste Dashboard ist nicht das mit den meisten Charts – sondern das, das Entscheidungen beschleunigt."
— Till FreitagWhy Your Sales Reporting Is Probably Broken
Every week, the same ritual: Someone opens five tabs, copies numbers into a presentation, and sends it around as a PDF. By the time the board meeting happens, the data is already outdated.
The problem isn't that you don't have data. The problem is that it's in the wrong place, in the wrong format, at the wrong time.
Sales dashboards in monday CRM solve this – but only when they're set up correctly. That's exactly what this guide is about.
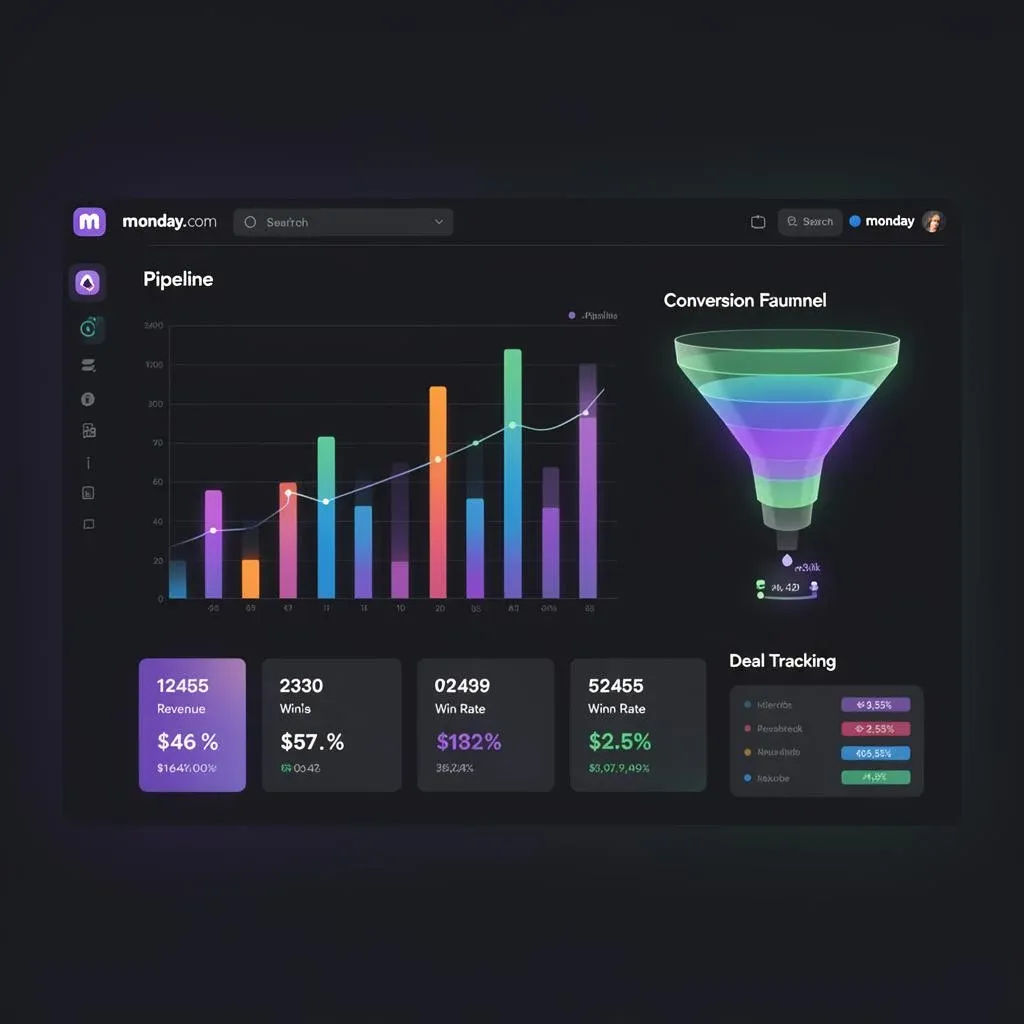
The 7 KPIs Every Sales Dashboard Needs
Before you place widgets: Clarify which numbers actually drive decisions. Here are the seven we recommend in almost every project:
Must-Have KPIs
| KPI | What It Measures | Why It Matters |
|---|---|---|
| Pipeline Value | Total value of all open deals | Shows whether there's enough in the funnel |
| Win Rate | Close rate (Won / Total) | Quality of your sales process |
| Average Deal Size | Average deal value | Segmentation and planning |
| Sales Cycle Length | Days from first contact to close | Process efficiency |
| Revenue (Closed Won) | Actually won revenue | The only number that counts in the end |
Nice-to-Have KPIs
| KPI | What It Measures |
|---|---|
| Activities per Deal | Calls, emails, meetings per opportunity |
| Stage Conversion Rate | Conversion between individual pipeline stages |
3 Dashboard Levels: From Rep to CEO
The most common dashboard mistake: Everyone sees the same thing. A sales rep needs different information than a VP Sales or CEO. monday CRM solves this with views and permissions.
Level 1: The Rep Dashboard
For individual sales reps – focused on their own pipeline and next actions.
Widgets:
- Pipeline overview (own deals by stage)
- Open activities (calls, follow-ups due today)
- Won/Lost this week
- Upcoming closes (deals with close date in the next 7 days)
Goal: "What do I need to do today to hit my quota?"
Level 2: The Team Lead Dashboard
For team leads and sales managers – comparison across reps, pipeline health.
Widgets:
- Pipeline by rep (stacked bar chart)
- Win rate per rep
- New deals vs. closes (trend)
- Forecast vs. actual
- Stuck deals (>30 days without activity)
Goal: "Where do I need to step in? Who needs support?"
Level 3: The Executive Dashboard
For CEO, CRO, leadership – high-level, strategic.
Widgets:
- Revenue YTD vs. target
- Pipeline Coverage Ratio (Pipeline Value / Quota)
- Win Rate trend (month over month)
- Average Deal Size trend
- Top 10 deals (value + stage + probability)
Goal: "Are we hitting our annual targets? How do things really stand?"
How to Build a Sales Dashboard in monday CRM
Step 1: Ensure Data Hygiene
The best dashboard is worthless if the underlying data is poor. Check:
- Every deal has an owner, a deal value, and a close date
- Pipeline stages are clearly defined (max. 5–7 stages)
- Status columns are consistently maintained
- No zombie deals (open deals with no activity for months)
"Garbage in, garbage out – this applies to dashboards more than anything else."
Step 2: Create the Dashboard
In monday CRM:
- New Dashboard → Give it a name (e.g., "Sales Performance Q1")
- Select board source (your deals board)
- Add widgets (chart, numbers, battery, table)
Step 3: Choose the Right Widget Types
| Widget Type | Ideal For | Example |
|---|---|---|
| Numbers | Single KPIs | Revenue, deal count, avg deal size |
| Chart (Pie) | Distribution | Deals by stage, by source |
| Chart (Bar) | Comparisons | Pipeline per rep, won vs. lost |
| Battery | Goal attainment | Quota progress (65% of target) |
| Timeline | Time distribution | Expected close dates |
| Table | Detail data | Top deals with value, stage, owner |
Step 4: Configure Filters and Time Ranges
- Default filter: Current quarter + own deals (for rep dashboard)
- Comparison period: Show previous quarter or year
- Dynamic filters: "Last 30 days" instead of fixed dates – keeps the dashboard always current
Step 5: Automations for Reporting
Instead of manually opening the dashboard – let it come to you:
- Monday 9:00 AM → Pipeline summary via email to team lead
- Friday 4:00 PM → Weekly sales report to leadership
- Deal Won → Automatic Slack notification in the sales channel 🎉
- Deal >30 days stuck → Reminder to owner + manager
Common Dashboard Mistakes (and How to Avoid Them)
| Mistake | Problem | Solution |
|---|---|---|
| Too many widgets | Information overload | Max. 6–8 widgets per dashboard |
| Vanity metrics | Numbers that look good but say nothing | Every widget must enable a decision |
| No drill-down | "The number looks off, but I can't dig in" | Clickable widgets that link to the board |
| Static time ranges | Dashboard shows Q3 2025 when we're in Q1 2026 | Use dynamic time filters |
| No targets | Numbers without context | Targets as reference lines in charts |
New: monday Vibe – Build Dashboards with a Prompt
Since 2026, monday.com offers monday Vibe – a completely new way to create dashboards: using natural language.
Instead of manually configuring widgets, you simply describe what you want to see:
"Show me the pipeline by rep, win rate for the last 3 months, and all deals over 50k that have been stuck for 2+ weeks."
monday Vibe automatically creates a dashboard with the right widgets, filters, and data sources.
What monday Vibe Can Do
- Dashboard creation via prompt: Describe your dashboard in one sentence – Vibe builds it
- Widget configuration: Chart type, filters, time ranges are auto-selected
- Iterative refinement: "Change the bar chart to a line chart" or "Add the forecast"
- Cross-board data: Vibe connects data from multiple boards into one dashboard
When to Use Classic vs. Vibe?
| Scenario | Recommendation |
|---|---|
| First dashboard setup | Vibe – rapid prototype in minutes |
| Pixel-perfect layouts | Classic – full control over positioning |
| Ad-hoc analyses | Vibe – "Show me X quickly" |
| Standardized team dashboards | Classic – build once, use permanently |
| Exploring new KPIs | Vibe – test quickly what works |
Our tip: Start with Vibe for the first draft, then refine with classic widgets. This combines speed with precision.
Advanced: Dashboard Strategies
The "Morning Standup" View
A dashboard that guides your team through the daily standup in 5 minutes:
- New deals since yesterday
- Deals in closing stage (what's about to close?)
- Blocked deals (where are things stuck?)
- Activities due today (who needs to call whom?)
No meeting needed – the dashboard replaces 80% of all status calls.
Pipeline Coverage Ratio
The one number that makes sales leaders sleep well or stay up at night:
Pipeline Coverage = Open Pipeline Value ÷ Quota
- < 2x: Alarm – not enough in the funnel
- 2–3x: Healthy – enough buffer for the win rate
- > 4x: Caution – are the deals realistically valued?
Track Forecast Accuracy
Compare monthly: What did you forecast vs. what was actually won? Over 3–6 months, you'll see how reliable your pipeline data really is.
The Path to Data-Driven Sales
| Phase | Goal | Duration |
|---|---|---|
| Phase 1 | Basics: Pipeline dashboard + won/lost tracking | 1 week |
| Phase 2 | Role-based: Separate rep, lead, exec dashboards | 1–2 weeks |
| Phase 3 | Automations: Auto-reports, alerts, Slack notifications | 1 week |
| Phase 4 | Optimization: Forecasting, coverage ratio, trend analysis | Ongoing |
Conclusion: Dashboards That Accelerate Decisions
The best dashboard isn't the prettiest or the one with the most charts. It's the one where everyone on the team knows within 10 seconds: Where do we stand, and what do I need to do next?
Real-time data instead of Friday spreadsheets. Role-based views instead of one-size-fits-all. Automated reports instead of manual copy-paste.
That's data-driven sales – and that's exactly what we build for you.
Want sales dashboards your team will actually use? Let's plan your dashboard setup →
Verwandte Artikel
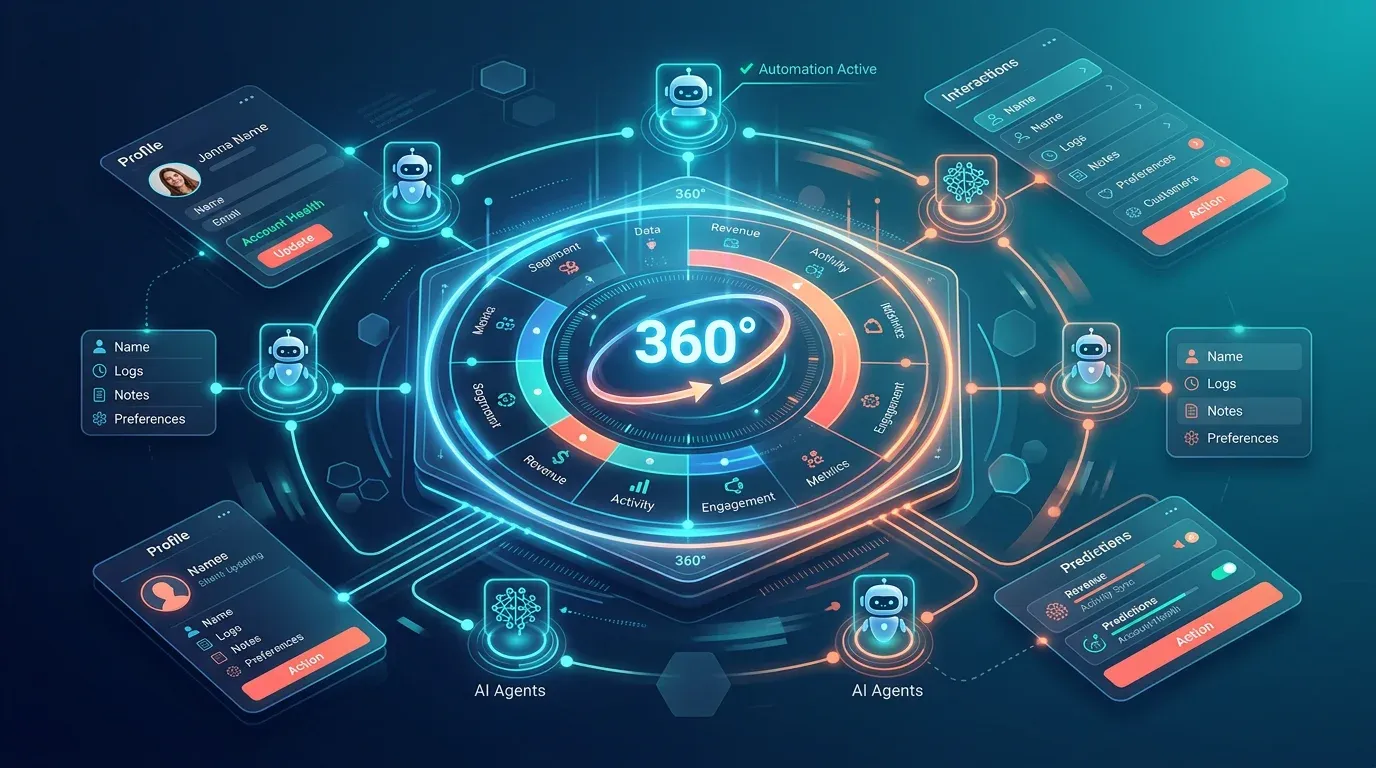
Account360 & Zero Update CRM: Die Zukunft von monday CRM (2026)
Account360 liefert die 360°-Kundensicht, Zero Update CRM eliminiert manuelle Datenpflege. So revolutioniert monday CRM d…
Weiterlesen
monday CRM vs. LeadTable: Welches CRM passt zu deiner Agentur?
monday CRM vs. LeadTable – Full-Stack-Plattform oder spezialisiertes Agentur-Tool? Wir vergleichen Features, Preise und …
Weiterlesen
monday CRM AI Agents – So automatisierst du deinen gesamten Sales-Prozess 2026
AI Agents in monday CRM übernehmen Pipeline-Pflege, Follow-ups und Lead-Scoring automatisch. So sieht der Sales-Prozess …
Weiterlesen
Insightly vs. monday CRM – Ehrlicher CRM-Vergleich 2026
Insightly oder monday CRM? Ein ehrlicher Vergleich – Features, Preise, Projektmanagement-Integration und eine klare Empf…
Weiterlesen
Freshsales vs. monday CRM – Ehrlicher CRM-Vergleich 2026
Freshsales oder monday CRM? Wir vergleichen Features, Preise und KI-Funktionen – und zeigen, welches CRM 2026 wirklich z…
Weiterlesen
CRM-Daten automatisch anreichern: Wie AI dein Sales-Team von Datenpflege befreit
Manuelle CRM-Datenpflege ist tot. Wir zeigen, wie du mit Clay, Claude und monday CRM einen nächtlichen Enrichment-Workfl…
Weiterlesen
monday CRM vs. Bigin by Zoho – CRM-Vergleich 2026
monday CRM oder Bigin by Zoho? Wir vergleichen beide CRM-Systeme ehrlich – Features, Preise, Skalierbarkeit und für wen …
Weiterlesen
Zoho CRM vs. monday CRM – Ehrlicher CRM-Vergleich 2026
Zoho CRM oder monday CRM? Der ehrliche Vergleich – Features, Preise, Ökosystem und klare Empfehlung für 2026.…
Weiterlesen
Deutsche CRM-Lösungen vs. monday CRM – Ehrlicher Vergleich 2026
CentralStationCRM, TecArt, Scopevisio, ADITO oder monday CRM? Wir vergleichen lokale deutsche CRM-Lösungen mit monday CR…
Weiterlesen